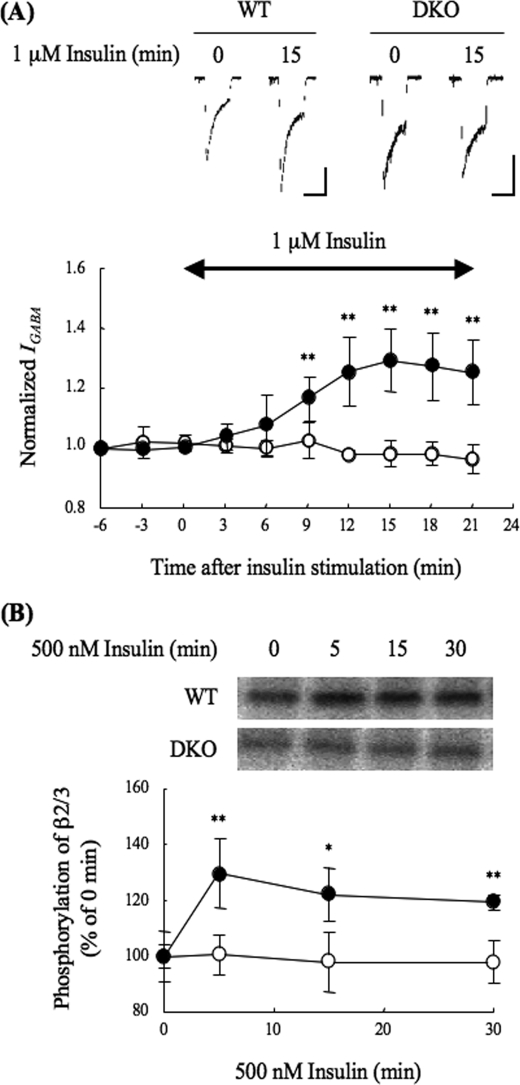
FIGURE 1.
Electrophysiological analysis of IGABA in insulin-stimulated hippocampal CA1 neurons and phosphorylation of the GABAA receptor β2/3-subunit. A, effect of insulin on IGABA. Electrophysiological experiments were performed using acutely prepared hippocampal CA1 neurons from WT (closed circles, n = 5) or DKO (open circles, n = 5) mice. GABA (3 μm) was applied for 15 s (3-min interval), and whole cell currents were recorded. Insulin (1 μm) was applied for the time period indicated by the double-headed arrow in graph. Upper panel shows representative GABA-induced current traces at 0 min or 15 min after insulin stimulation of WT or DKO neurons. Vertical and horizontal scales show 200 pA and 15 s, respectively. The graph shows the amplitude of IGABA normalized to that seen without insulin. All data are represented as means ± S.D. Significance was determined using the Student's t test (**, p < 0.01, compared with the results from DKO). B, phosphorylation of the β-subunit in response to insulin stimulation. The cultured cortical neurons (DIV. 14–18) of the WT or DKO mice were metabolically labeled with [32P]orthophosphates for 4 h. The neurons were stimulated with 500 nm insulin for the indicated time, and then the cell lysates were subjected to immunoprecipitation using an anti-GABAA receptor β2/3-subunit antibody. The immunocomplexes were separated by SDS-PAGE and then subjected to autoradiography. Phosphorylated bands were detected using BAS2500. The autoradiograph represents one of four independent experiments. The other experiments gave similar results. The graph shows quantitative data concerning the phosphorylation of the GABAA receptor β2/3-subunit of WT (closed circles) or DKO (open circles) neurons. As mentioned above, 32P incorporation was analyzed, because the phosphospecific antibody currently available recognizes the di-phosphorylated β3-subunit at both Ser-408 and Ser-409 (29, 41), and insulin causes a single phosphorylation at Ser-410 or Ser-409 of β2- or β3-subunit, respectively (11, 12). Data are represented as means ± S.D. (n = 4). Significance was determined using the Student's t test (*, p < 0.05; **, p < 0.01, compared with the results from DKO).

