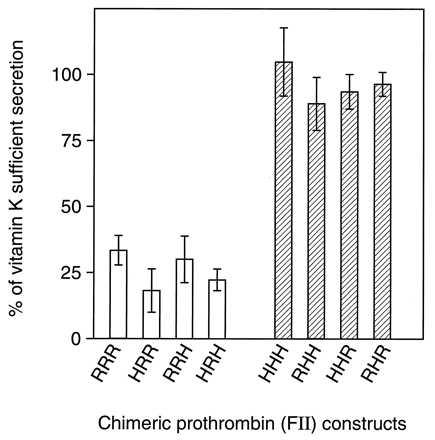
Figure 6.

Quantitation of chimeric prothrombin construct expression in HEK293 cells. Gels from Figs. 1 and 5 were quantitated by densitometry. Ratios of lane 3 (medium from warfarin-treated cells) over lane 1 (medium from vitamin K-treated cells) were plotted as a percentage of vitamin K sufficient secretion. Data are mean ± SD (n = 3).
