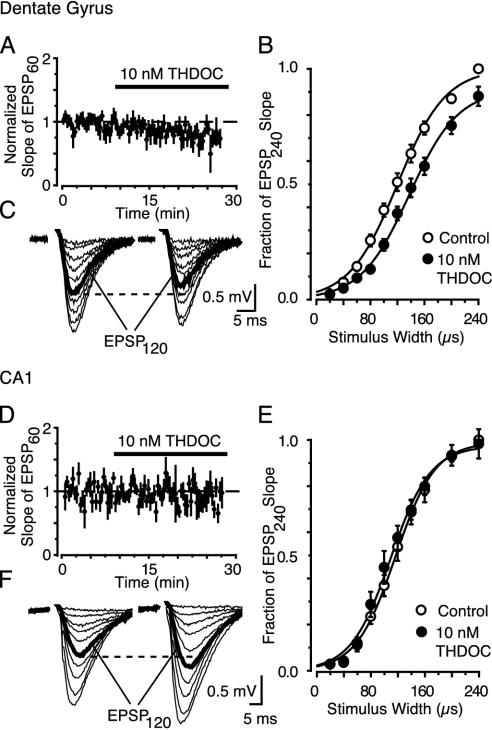
Fig. 4.
A physiological concentration (10 nM) of THDOC reduces the fEPSP slope when δ-subunits are present. (A and D) Time vs. average fEPSP slope evoked by W = 60 μs (EPSP60). Data were pooled and normalized to the average fEPSP slope evoked during first 10 min (n = 4 slices). (B and E) fEPSPs evoked during stimulus response curves before (Left) and after (Right)10nM THDOC (20 min). The dashed line compares the two EPSP120 responses (bold, evoked by a W closest to the fitted W50). (C and F) Stimulus–response curves after 20 min of 10 nM THDOC (•) in the dentate gyrus (C) or the striatum radiatum of CA1 (F). Data (±SEM) are normalized to the slope of the EPSP240 (evoked by W = 240 μs) under control conditions (○). Lines represent the Boltzman equation fitted to the means.

