FIGURE 4.
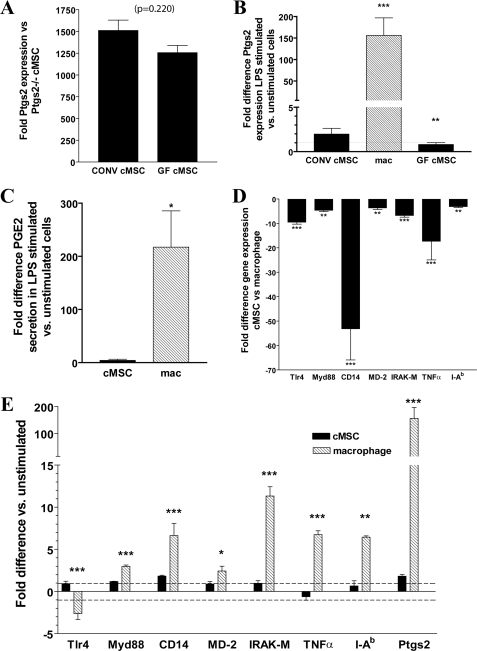
High constitutive expression of Ptgs2 is not due to TLR activation. Colonic MSCs from CONV and GF mice and bone marrow-derived macrophages were isolated and analyzed. A, graph of Ptgs2 expression difference in cMSCs isolated from CONV (n = 3 lines) and GF mice (n = 2 lines) measured by qRT-PCR (base line: cMSCs from CONV Ptgs2−/− mice). p = 0.220, Student's t test. B, graph of Ptgs2 expression difference in MSCs and macrophages plated and stimulated by LPS (1–100 ng/ml) for 21 h (base line: unstimulated cells). C, graph of PGE2 secretion -fold difference (base line: secretion from unstimulated cells) from cells stimulated by LPS measured by an enzyme-linked immunosorbent assay of supernatants from cMSC (n = 3 lines) and macrophages (n = 3). D, graph of TLR4 pathway member gene expression -fold difference in cMSCs (n = 3 lines) base-lined to macrophages (n = 3 lines) for each gene measured by qRT-PCR. E, graph of -fold expression difference in members of the TLR4 pathway and target genes measured by qRT-PCR in 21-h LPS-stimulated cells (base line: unstimulated cells). Statistical markings represent significance in the -fold difference of a given gene in cMSCs compared with the -fold difference of that gene in macrophages. Error bars, S.D. Statistical analysis by analysis of variance and Bonferroni post-test (B) or Student's t test (A and E) is shown: *, p < 0.05; **, p < 0.01; ***, p < 0.001. TNFα, tumor necrosis factor-α.

