FIGURE 5.
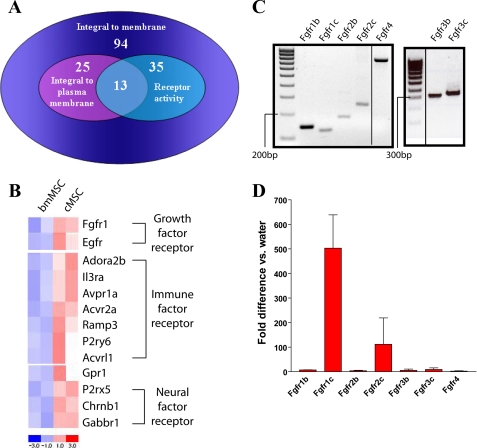
Comparison of cMSCs with bmMSCs reveals possible mechanistic pathways involved in Ptgs2 expression. A, Venn diagram illustrating the intersection of the GO terms “integral to plasma membrane” and “receptor activity” obtained through GO analysis of genes preferentially expressed in cMSCs (compared with bmMSCs). Data for analysis were obtained by isolation of total RNA from cMSCs (n = 2 lines) and bmMSCs (n = 2 lines), amplification and cRNA labeling, hybridization to Affymetrix MOE430A microarrays, and dCHIP analysis of genes preferentially expressed in one cell type or the other at a 1.3-fold level, p < 0.05. B, heat map generated by dCHIP software of genes fitting into the logical intersection of “integral to plasma membrane” and “receptor activity” showing relative expression levels in each cell line. C, electrophoresis gel of PCR amplifying cDNA obtained from whole WT C57Bl/6 mouse intestine for the FGF receptor splice forms: Fgfr1b, Fgfr1c, Fgfr2b, Fgfr2c, and Fgfr4 (annealing temperature = 60 °C) and Fgfr3b and Fgfr3c (annealing temperature = 65 °C). D, graph of qRT-PCR measurements of the various splice forms of the FGF receptors expressed in cMSCs (n = 3 lines) compared with water control. Error bars, S.D.

