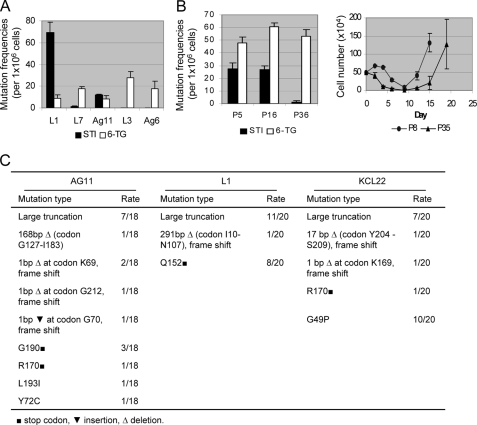
FIGURE 5.
Comparison of BCR-ABL mutations with spontaneous HPRT mutations. A, measurement of BCR-ABL and HPRT mutation rates. One million cells of each clone were plated on soft agar with 2.5 μm imatinib (STI) or 2.5 μg/ml 6-thioguanine (6-TG) for side-by-side analysis of BCR-ABL and HPRT mutation frequencies, respectively. B, left, BCR-ABL and HPRT mutation rates of KCL-22 cells at passages 5, 16, and 36 measured by soft agar clonogenic assay. Imatinib, 5 μm; 6-thioguanine, 2.5 μg/ml. Right, time courses for relapse of KCL-22 cells on 2.5 μm imatinib at passages 8 and 35. Relapsed cells harbored T315I mutation in both cases. C, HPRT mutation spectrum. Ag11, L1, or KCL-22 cells were seeded on soft agar with 6-thioguanine, and 20 colonies each were picked for analysis of HPRT codon mutations. For Ag11, two colonies had sequencing failure and were excluded.

