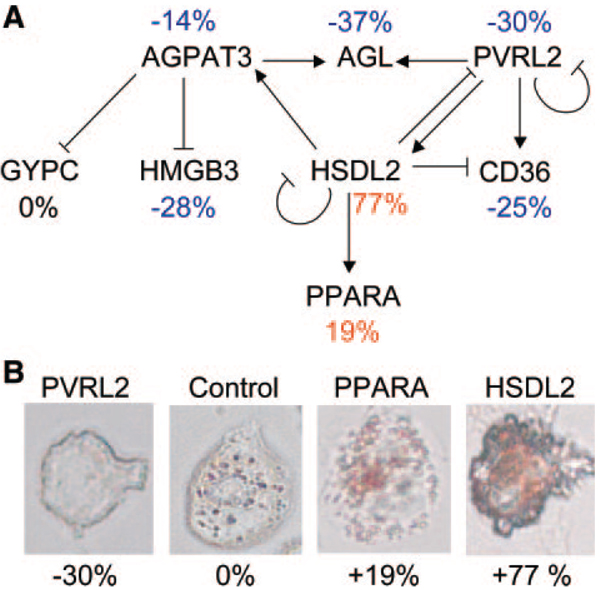
Figure 4.
A regulatory network for foam cell formation based on in vivo expression analyses in mice followed by perturbation in vitro. A, The above genes were found to be differentially regulated in the response to cholesterol lowering in atherosclerotic lesions in mice. They were then subjected to in vitro siRNA “knockdown” studies in a macrophage cell line. The predicted interactions (edges) are indicated, along with the percent change in cholesterol accumulation after cholesterol loading. Blue indicates an inhibition of cholesterol loading; red, an increase; and black, no change. B, Representative siRNA-treated cells are shown after 48 hours of incubation with acetylated low-density lipoprotein and staining for neutral lipids with Oil Red O. AGPAT3 indicates 1-acylglycerol-3-phosphate O-acyltransferase 3; AGL, amylo-1,6-glucosidase, 4-α-glucanotransferase; PVRL2, poliovirus receptor-related 2; GYPC, glycophorin C; HMGB3, high-mobility group box 3; HSDL2, hydroxysteroid dehydrogenase-like 2; CD36, CD36 molecule; PPARA, peroxisome proliferator-activated receptor-α. Reproduced from Skogsberg et al29 under the Creative Commons Attribution License. Copyright © 2008 Skogsberg et al.

