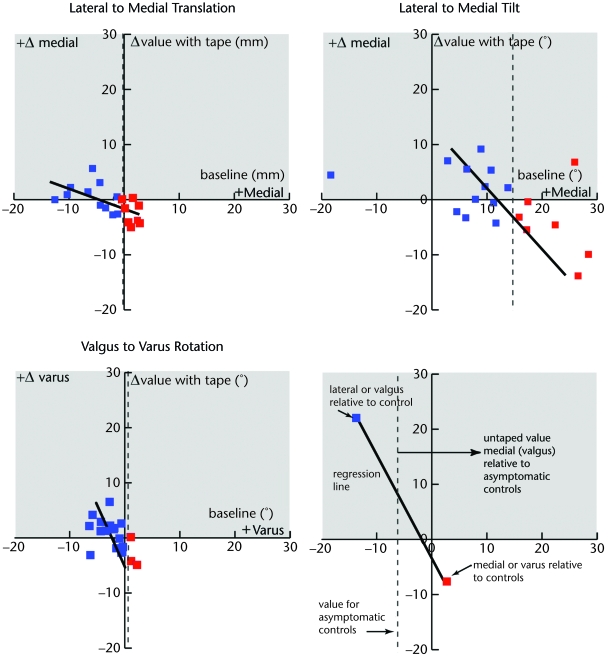
Figure 2.
Change in kinematics with taping (taped and untaped conditions) versus baseline. The 3 variables with significant correlations between the change with taping and the baseline value are shown (top row: lateral to medial displacement and lateral to medial tilt; bottom row: valgus to varus rotation and legend to symbols). The x-axis indicates the untaped value of each variable (positive values indicate medial displacement, medial tilt, and varus rotation). The y-axis indicates the change in each variable with taping (positive values indicate medial displacement, medial tilt, and varus rotation with taping, shown by gray shading). The regression lines are shown for each variable set using a thick black line. Based on previous work,34 the average value for an asymptomatic cohort (untaped, n=34) for each of the 3 variables is shown using a vertical dashed line (medial displacement=−0.11 mm, medial tilt=14.7, varus rotation=0.52°). All graphs represent kinematics at 10 degrees of knee extension. Participants who were laterally translated, laterally tilted, and in valgus rotation (relative to the asymptomatic population) are shown in blue. This distinction is independent for each graph. Thus, a single participant who demonstrated medial displacement and lateral tilt at baseline would be designated by 2 different colors in each of the respective graphs.

