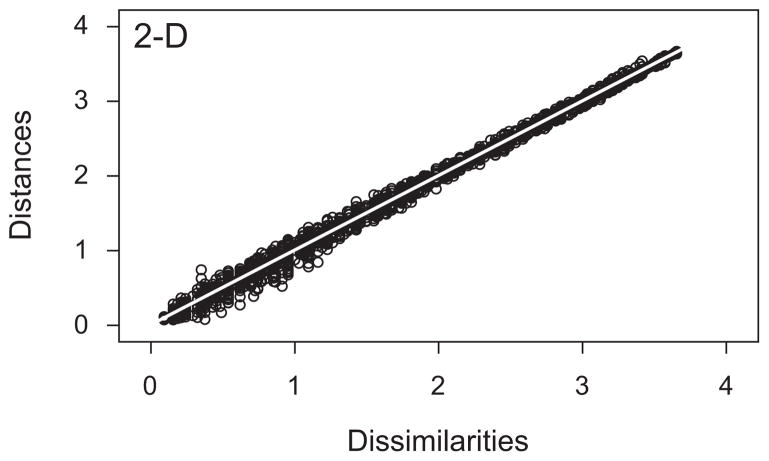
Figure 5.
Shepard plot based on the 2-D multidimensional scaling (MDS) solution. Points represent the interpoint distances from the MDS solution space versus the original dissimilarities among items. Note the relatively narrow scatter of points around the white 1:1 line and the absence of obvious systematic trends to the scatter.

