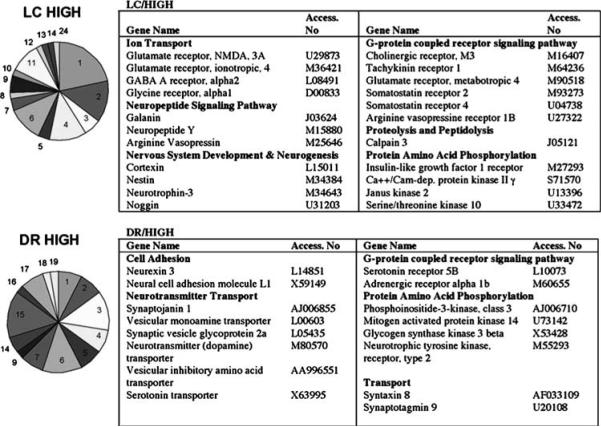
Figure 2.
Regional differences in gene expression between LC and DR. Genes from the hierarchical clustering (LC/HIGH and DR/HIGH) were grouped according to GO biological function and are represented in pie chart form. 1 = ion transport, 2 = G-protein-coupled receptor protein signaling pathway, 3 = miscellaneous, 4 = regulation of transcription, 5 = transport, 6 = protein amino-acid metabolism, 7 = intracellular signaling cascade, 8 = immune/inflamatory response, 9 = neuropeptide signaling pathway, 10 = proteolysis/peptidolysis, 11 = nervous system development/neurogenesis, 12 = response to hypoxia/oxidative stress, 13 = apoptosis, 14 = cell adhesion, 15 = neurotransmitter transport, 16 = DNA repair, 17 = neurotransmitter biosynthesis and catabolism, 18 = cytoskeleton organization, 19 = protein processing and folding, 20 = energy reserve metabolism, 21 = regulation of cell cycle/cell growth, 22 = RNA processing, 23 = neurotransmitter secretion/synaptic transmission, 24 = metabolism, 25 = myelination. Representative gene products of some functional categories that were differentially expressed are listed in the tables to the right of the pie chart and grouped according to GO biological function.

