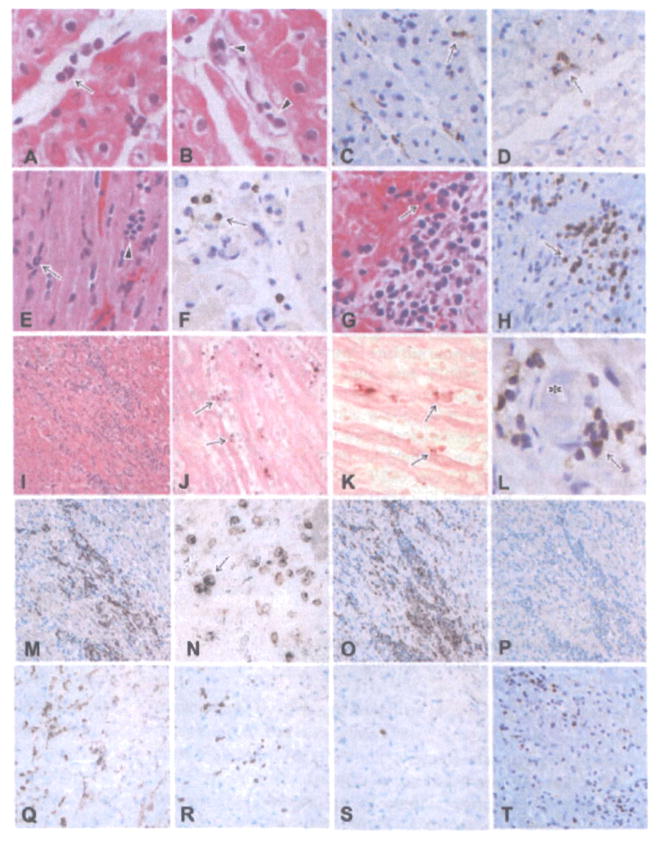
Figure 4. Histological features of grafts showing graft infiltrating cells and the development of acute cellular xenograft rejection (ACXR).

Polymorphonuclear leukocytes (arrow in A), mononuclear cells (arrowheads in B), CD68+ macrophages (arrow in C) and a small number of CD3+ cells (arrow in D) infiltrated the graft 7 days after transplantation. In the healthy-graft group (E, F: B216, day 56; E: HE stain, F: CD3 stain), polymorphonuclear leukocytes (arrow in E) and mononuclear cells (arrowhead in E), including a small number of CD3+ cells (arrow in F), infiltrated the grafts. In rapidly weakened group (G, H: B218, day 67; G: HE stain, H: CD3 stain) and gradually weakened group (I: B223, day 110, HE stain), focal mononuclear cell infiltration was evident in the graft, showing ACXR. Some TUNEL+ dead cells (arrows in J, K) were seen in contact with infiltrating mononuclear cells (J, K: B223, day 110, TUNEL stain). Some thrombi (asterisk in L) were present with CD3+ cell infiltration (arrow) (L: B223, day 110, CD3 stain). The phenotypes of the infiltrating cells included many CD3+ T cells (H, M, T), both TIA-1 and CD3+ cytotoxic T cells (N), CD68+ macrophages (O), CD4+ cells (Q), CD8+ cells (R) and a small number of CD20+ B cells (P) and NKB-1+ NK cells (S) (M–P: B223, day 110, Q–T: B229, day 179; M, T: CD3 stain, N: two-color stain with CD3 (brown) and TIA-1 (blue), O: CD68 stain, P: CD20 stain, Q: CD4 stain, R: CD8 stain, S: NKB-1 stain).
