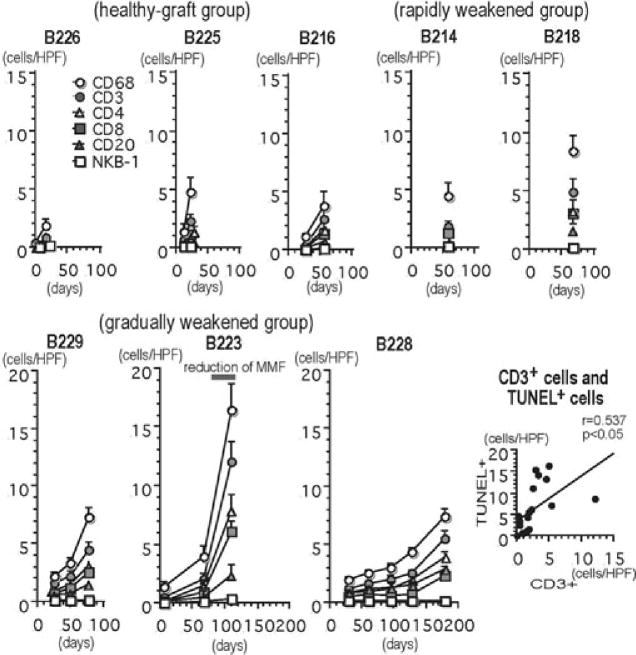
Figure 5. The number of infiltrating cells in the grafts (cells/single field of 0.0625 mm2) and the correlation between CD3+ T cells and TUNEL+ dead cells.
The number of infiltrating cells of all phenotypes except NKB-1+ cells increased after transplantation and during the development of graft failure (healthy-graft group: B226, B225 and B216; rapidly weakened group: B214 and B218 and gradually weakened group: B229, B223 and B228). The results are depicted as the mean ± standard error, as calculated from 40 randomly selected fields. There was a statistically significant correlation between the number of CD3+ T cells and the number of TUNEL+ dead cells in capillaries and the interstitium in the grafts (p < 0.05).

