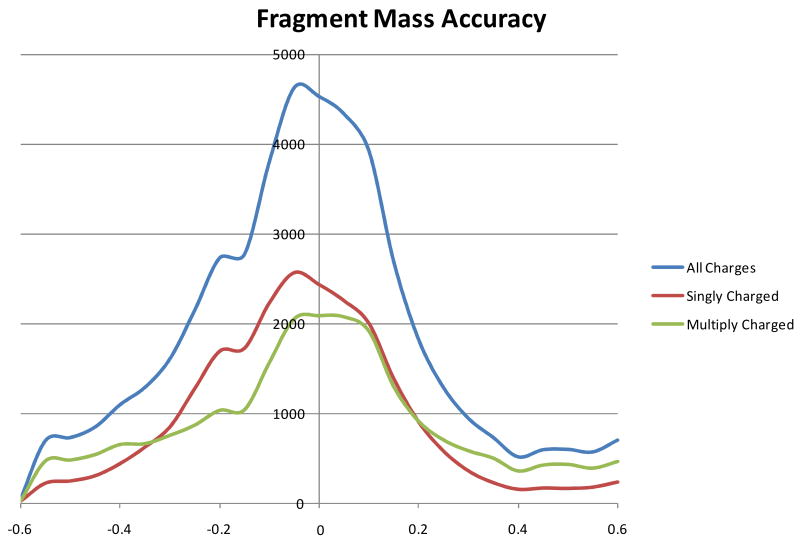
Figure 1.
Histogram of the frequency of matching ions in ETD spectra as a function of the mass error between theoretical and observed m/z. Data was binned into 0.05 Da intervals. The blue line shows results for all assignments, whereas the red and green lines separate results by charge state of assignment.

