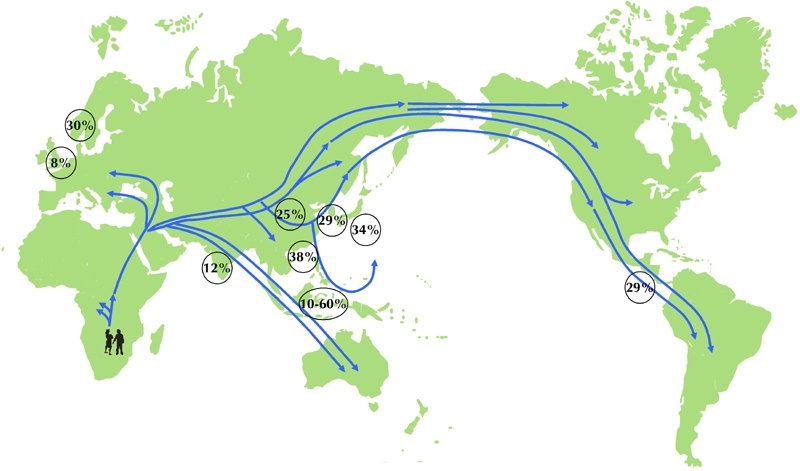
Figure 2. The prevalent rate of the mtDNA 16189 variant traced along the ancient path of human migration.

The encircled data represent the percentages of the population in a given country/region with the mtDNA 16189 variant according to available study data. The incidences are given for England (8%), Finland (30%), India (12%), China (25%), Korea (29%), Japan (34%), Taiwan (38%), Indonesian archipelago (10%-60%), and Panama (29%) [82, 85, 89, 90-98]. The world map shows possible migration routes of different people, as suggested by studies of mitochondrial DNA. The map is modified from [100].
