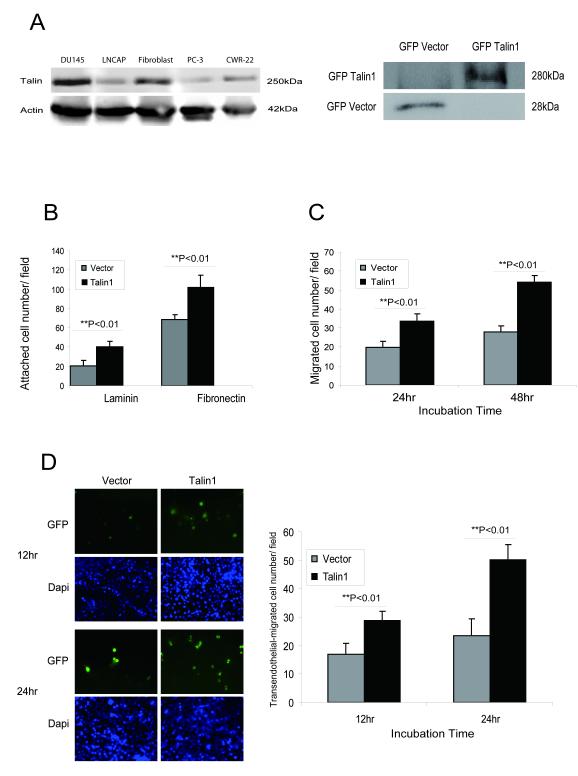
Figure 2. Talin1 Enhances Cell Adhesion, Migration and Invasion.
Panel A, Talin1 endogenous expression in human prostate cancer cell lines; actin expression is used as a loading control. Bands detected indicate GFP-talin1 (280kDa) and GFP-vector protein (28kDa) respectively. Panel B, Cell adhesion potential was comparatively analyzed in laminin or fibronectin-coated plates in PC-3 GFP vector control and PC-3 GFP- talin1 cloned transfectants. Values represent the mean from three indepeden experiments performed duplicate ± SEM. Panel C, PC-3 cells were subjected to wounding and migrating cells were counted under the microscope in three independent fields (3 wells/condition). Panel D, The transendothelial migration assay was performed using HBMECs, and either PC-3 GFP-vector or PC-3 GFP-talin1 expressing cells, as described in “Materials and Methods”. Green and blue staining indicated GFP vector/talin1 cells and DAPI nuclear staining, respectively. Numerical data represent values from three independent experiments ± SEM.

