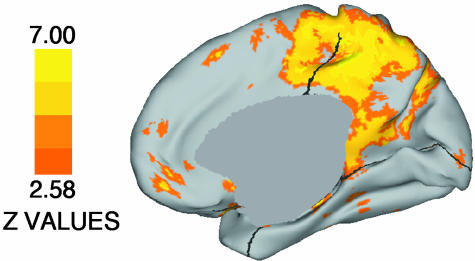
Fig. 3.
Map of statistically significant group differences across the brain. Brighter colors indicate areas of greater statistical significance. Note that the medial parietal/posterior cingulate cortex showing large group differences here overlaps heavily with the BA 31 region showing robust group differences in the a priori analyses (compare with Fig. 1D).

