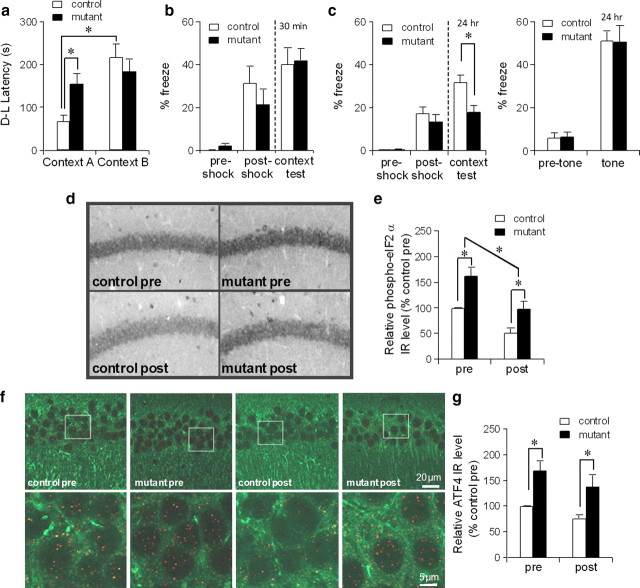
Figure 6.
Consolidation of context-specific memory was impaired after PKR activation. a, Mutant mice, but not fPKR controls, were impaired in context-specific memory formation in the step-through active avoidance paradigm 2 h after AP20187 infusion. F(1,36) = 5.98 for genotype × context interaction, p < 0.02, post hoc Fisher's LSD test, *p < 0.05. Twelve controls and 11 mutants were used for the context A test; 8 controls and 9 mutants were used for the context B test. b, Mutant mice and control mice underwent fear conditioning 2 h after AP20187 infusion. Contextual freezing during the conditioning and 30 min after the training was similar between mutant (n = 8) and control mice (n = 8), suggesting acquisition and retrieval of memory was not affected by the drug infusion. c, Mutant mice (n = 20) were impaired in contextual memory 24 h after the training compared to controls (n = 21) (left panel). Both genotypes showed normal levels of freezing during the tone presentation (right panel). Student's t test, *p < 0.05. d, e, Anti-phospho-eIF2α staining was performed using mutant and fPKR brains obtained 2 h after AP20187 infusion but immediately before fear conditioning (pre) or 2 h after fear conditioning (post). Both genotypes showed postconditioning decrease in phospho-eIF2α levels in CA1 pyramidal cells. Levels in mutants were higher than those in controls both before and after conditioning. Immunostaining was quantified by measuring mean intensity values of the CA1 cell layer using NIH ImageJ. F(1,12) = 20.4 for genotype effect, p < 0.001; F(1,12) = 21.8 for pre–post effect, p < 0.001; post hoc Fisher's LSD test, *p < 0.05. f, g, Mutant ATF4-IR in CA1 pyramidal cells was higher than controls both before and 2 h after conditioning. Brain sections from mutants and fPKR controls were double stained with anti-MAP2 (Alexa Fluor 488, green) and anti-ATF4 (Cy3, red). Images were obtained by confocal microscope using ×63 oil objective. The ATF4 expression level in area CA1 was quantified by counting the number of red dots in the CA1 cell layer using NIH ImageJ. F(1,12) = 17.3 for genotype effect, p < 0.002; F(1,12) = 3.2 for pre–post effect, p = 0.1; post hoc Fisher's LSD test, *p < 0.05. Error bars represent SEM.

