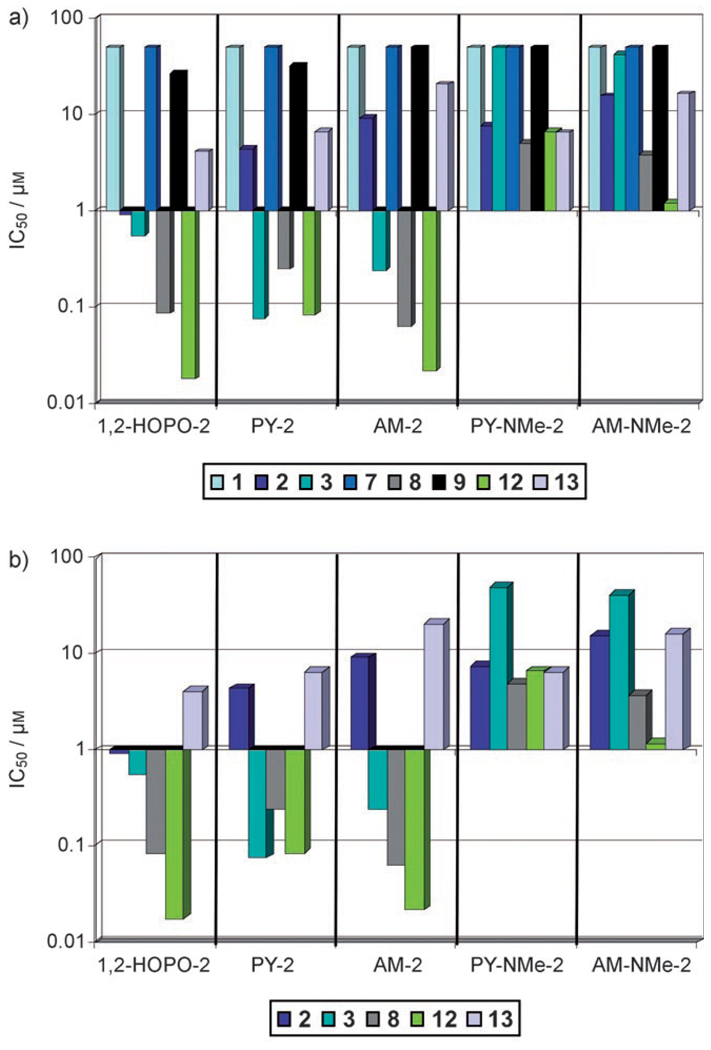
Figure 4.
Graph of IC50 values (on y-axis) from Table 1 plotted on a logarithmic scale for inhibitors 1–5. Each MMP is color coded as shown in the legend (MMP-2 dark blue; MMP-3 turquoise; MMP-8 gray; MMP-12 green; MMP-13 mauve). The top plot shows all of the MMPs tested and the bottom plot shows only the intermediate and deep S1′ pocket MMPs.

