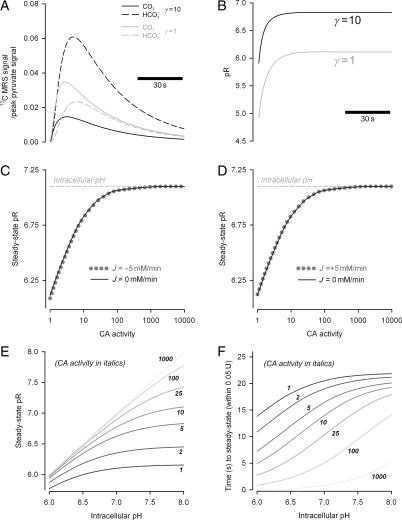
Figure 7.
The results of mathematically modelling our experimental data, acquired from control hearts and hearts perfused with ETZ. (A) Results from the model which best-fit our experimental data from Figures 4A and 5A. Experimental data were best reproduced with a 10-fold catalytic activity of CA. (B) The model simulation of pR, based on the time courses from (A). With moderate levels of CA activity, as may be expected in the heart, the H13CO3−/13CO2 ratio indicates a steady-state pR that closely approximates the physiological values. However, with lower CA activity, the model reproduced our experimental finding of pHi underestimation. (C) The relationship between CA activity and steady-state pR, in the presence (dashed grey) and absence (black solid) of HCO3− efflux or (D) influx. CA activity has a significant effect on the size of the pR–pHi discrepancy, but HCO3− transport has a much smaller impact on the discordance. (E) Relationship between steady-state pR and pHi, simulated for different levels of CA activity. (F) Relationship between equilibration time and pHi, simulated for different levels of CA activity. Equilibration time was estimated as the time taken for pR to approach steady-state pR within 0.05 U.

