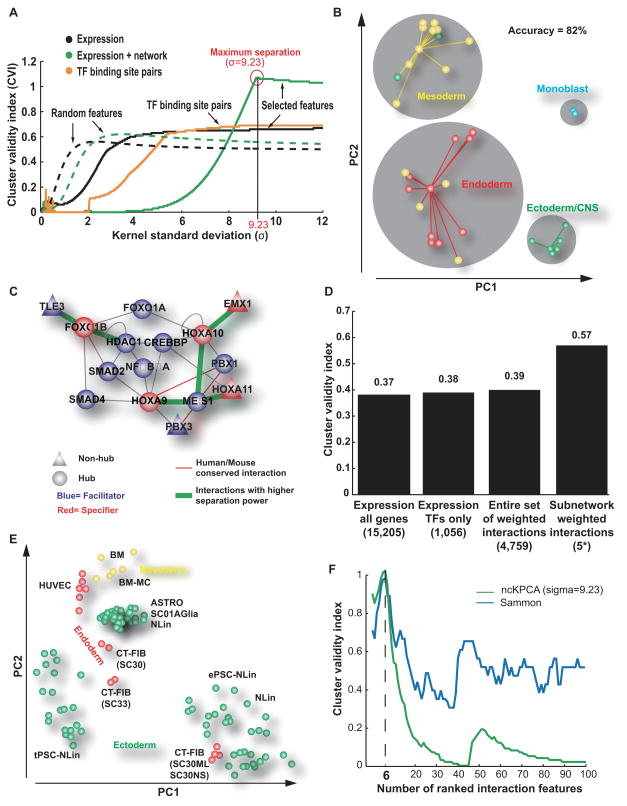
Figure 2. A homeobox network associated with tissue differentiation.
(A) Performance of tissue separation with (green solid curve) or without (black solid curve) information about TF protein-protein interactions (Supplementary Table 2). The Bezdek cluster validity index (CVI, y-axis) is a measure of separation between the four tissue classes. CVI is plotted for increasing kernel standard deviation (x-axis), the only tuning parameter of the ncKPCA algorithm used for tissue separation. Performance was also evaluated for TF pairs predicted to cooperate based on co-occurrence of TF binding sites (yellow curve) (Yu et al., 2006) as well as for random features (dashed curves). (B) Tissue dimensionality reduction by ncKPCA into the first two Principle Components (PCs), considering features derived from the six most informative TF-TF interactions. Points represent tissues derived from ectoderm (green), mesoderm (yellow), or endoderm (red), or a monocyte cell line (blue). Gray circles denote four clusters obtained by affinity propagation in the (PC1, PC2) space, with each point connected to its cluster exemplar. This figure is related to Figure S1. (C) Informative subnetwork containing six interactions (green) used to generate features for tissue separation. Also shown are the immediate network neighbors of the interacting TFs. (D) CVI for the separation of stem cells (Supplementary Table 6) using Sammon Mapping. Four feature sets are shown: the original expression values from Muller et al, the expression of the TFs only, the entire set of TF protein-protein interactions, or the features corresponding to the six interactions in panel C (5* indicates that the interaction HOXA9-MEIS1 was not considered because HOXA9 expression was not measured in the stem cell investigation of Muller et al). (E) Stem cell dimensionality reduction obtained by Sammon Mapping using the panel C interaction set. Points represent stem cell lines derived from ectoderm (green), mesoderm (yellow), or endoderm (red). (F) Good performance of tissue separation observed with two different algorithms. ncKPCA (green curve) and Sammon Mapping (blue curve). CVI (y-axis) is plotted against the number of PC2-ranked interactions used to separate tissues (x-axis). In both cases, the maximum performance is observed using the first six PC2-ranked interactions to separate tissues.

