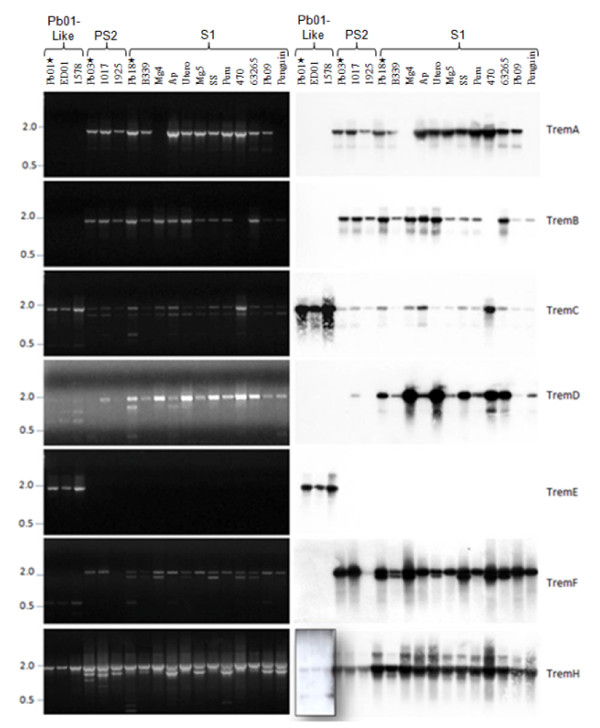
Figure 8.
PCR screening for Trem elements in different phylogenetic lineages of P. brasiliensis. Left: Electropherogram results from PCR analysis of a phylogenetically diverse panel of P. brasiliensis isolates. Oligonucleotide primer pairs are given in Additional File 7. PCR amplification of Trem elements in the genomic DNA of 18 isolates of P. brasiliensis, including cryptic species, using primers from the TIRs of each element indicated. Asterisks (*) indicate the P. brasiliensis isolates sequenced in the FGI of Broad Institute. Right: PCR amplicons were blotted onto nylon membranes and hybridized with Trem probes. Because the copy-number of each element differs among the P. brasiliensis isolates, exposure times for autoradiograms were not equivalent. They were: 20 h for TremD; 1 h for TremC and TremF; 10 min for TremA, TremB and TremE. Two different exposition times were used for TremH: 20 h (boxed area) and 10 min.

