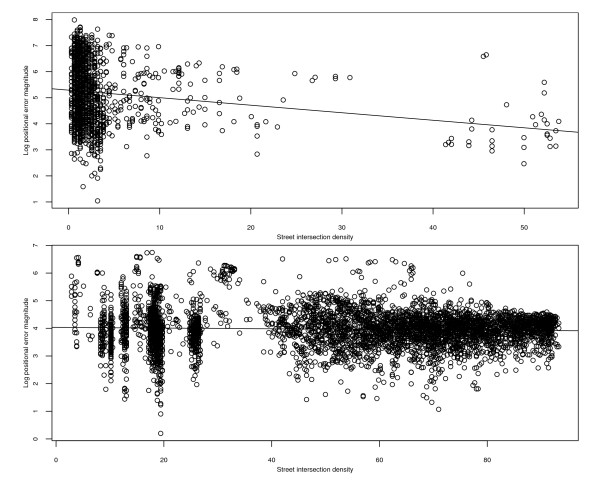
Figure 7.
Scatterplots of positional error magnitudes (on natural log scale) versus street intersection density for the automated geocodes of Carroll County addresses. Top panel: rural addresses. Bottom panel: municipal addresses. The superimposed lines are the fitted ordinary least squares regression lines. Units of street intersection density are intersections per square mile, and units of error magnitudes are meters.

