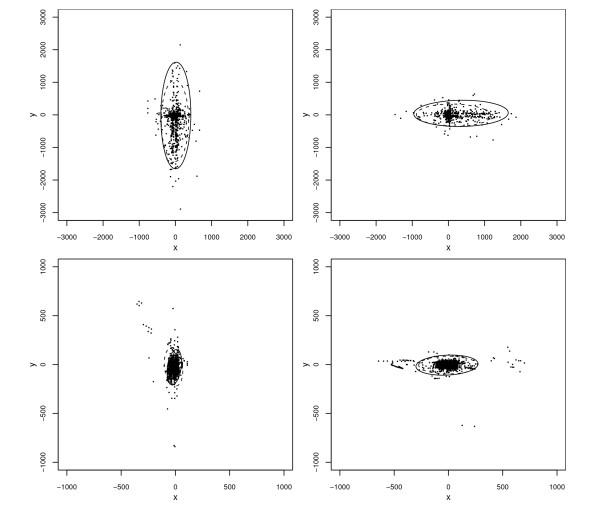
Figure 8.
Scatterplots of positional errors (in meters) for the automated geocodes of Carroll County addresses, by axial orientation of the street on which the corresponding address lies, with 95% normality-based tolerance regions for the inner 95% of the distributions. Upper left panel: rural address on N-S streets. Upper right panel: rural addresses on E-W streets. Lower left panel: municipal addresses on N-S streets. Lower right panel: municipal addresses on E-W streets. In all panels, the outer boundary of the normality-based and nonparametric elliptical tolerance regions are represented by solid and dashed curves, respectively.

