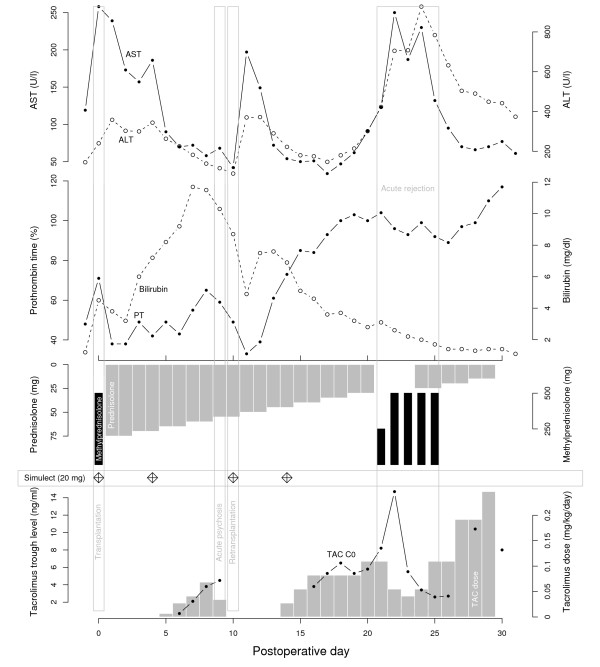
Figure 1.
Postoperative course of the patient. Postoperative course of the patient. Upper panel depicts aspartate transaminase (AST, solid line) and alanine transaminase (ALT, dashed line) plasma levels in units per liter. In the middle panel total bilirubin (dashed line) and prothrombin time (PT, solid line) in activity percentage is shown. The lower panel displays immunosuppression: methylprednisolone, black bars; prednisolone, grey upper bars; basiliximab (Simulect), diamonds; tacrolimus trough levels, solid line and dots; tacrolimus dose, lower grey bars.

