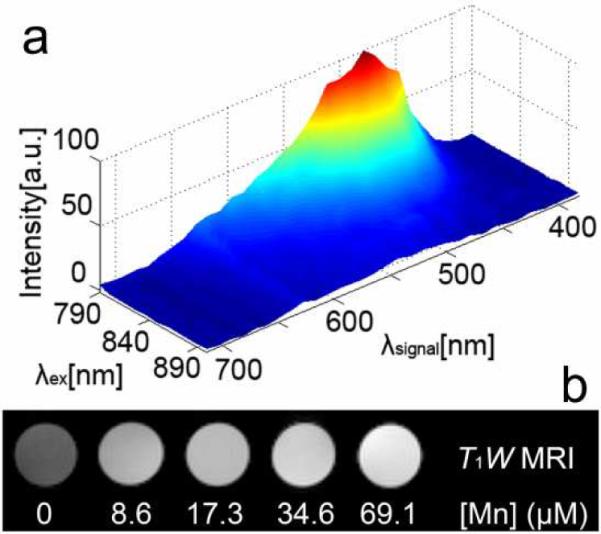
Figure 3.

(a) Two-photon 3D normalized luminescence signal data profile of DS SiMn QDs at different excitation wavelengths in water. The background signal measured in a random region without DS SiMn QDs was subtracted. Color code: dark blue corresponds to zero intensity and dark red corresponds to maximal intensity; (b) The DS SiMn QDs aqueous solutions imaged by MRI show different brightness depending on the manganese concentration.
