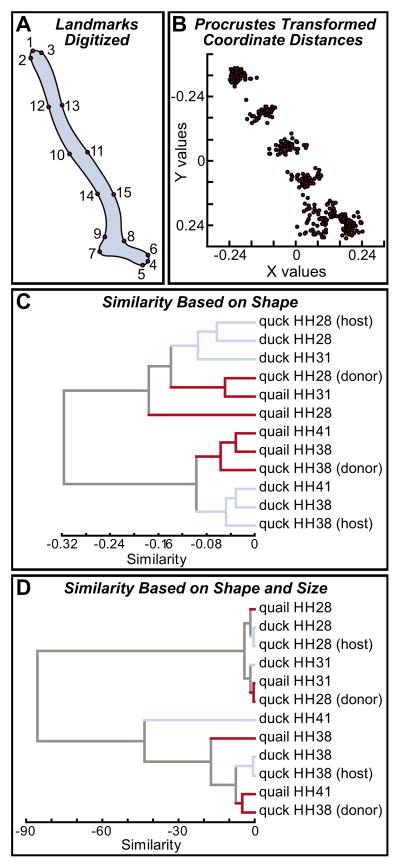
Fig. 3. Landmark-based analysis of ontogenetic and phylogenetic size and shape.
(A) Fifteen landmark points were selected along Meckel’s cartilage in quail, duck and/or quck embryos at HH28, HH31, HH38 and HH41. (B) X, Y coordinate data were analyzed using a Procrustes method, which removes the factor of size and reveals shape differences. (C) The average of the squared magnitudes of the vectors produced distance coefficients that were used in cluster analyses (unweighted pair group method using arithmetic averages). On the basis of overall shape similarity, duck at HH28 and HH31, and the duck host side of quck at HH28 were more alike than quail at HH31 and the quail donor side of quck at HH28; quail at HH38 and HH41, and the quail donor side of quck at HH38 were more alike than duck at HH38 and HH41, and the duck host side of quck at HH38. (D) When differences in size were included in the analysis, the groups clustered mostly by stage rather than by species. In addition, the relative amount of similarity was much less between early and late stages due to the vast differences in size between early and late stages (i.e. those associated with growth), and between quail and duck (i.e. those that are species specific).

