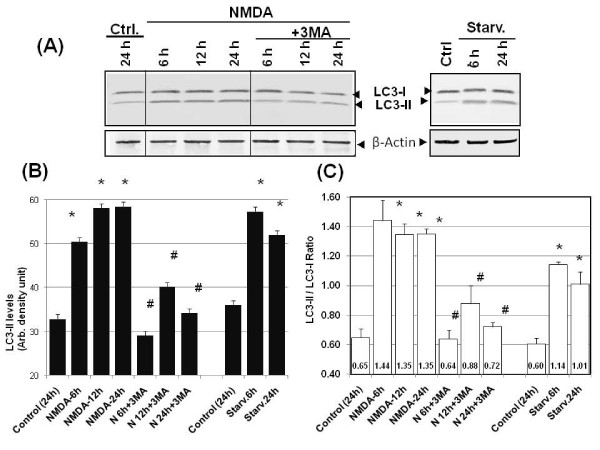
Figure 5.
NMDA challenge induced LC3-II accumulation which is 3-MA sensitive. A) Lysates were obtained from control neuronal cultures (at 24 h) and at 6, 12 and 24 hours from neuronal cultures treated with NMDA or NMDA+3-MA (left panels). For classic autophagy positive controls, 6 h and 24 h amino acid starvation in neurons were also included (right panels). These lysates subjected to immunoblotting were probed with anti-LC3 and β-actin antibody. Representative immunoblots are shown (n = 4). β-actin was used as a loading control. B) LC3 immunoblot band intensities were quantified densitometrically and the values plotted. The expressed values are means ± S.E.M. (n = 4; *p < 0.05 compared to controls; #p < 0.05 compared to NMDA-treated). C) LC3-II/LC3-I ratio was also calculated plotted. The expressed values are means ± S.E.M. (n = 4); *NMDA groups or starvation groups significantly higher than control (*p < 0.05, Student paired T-test); #3-MA treatment groups significantly lower than respective NMDA groups (#p < 0.05, Student paired t-test). The individual ratio value is also listed at the bottom of each bar.

