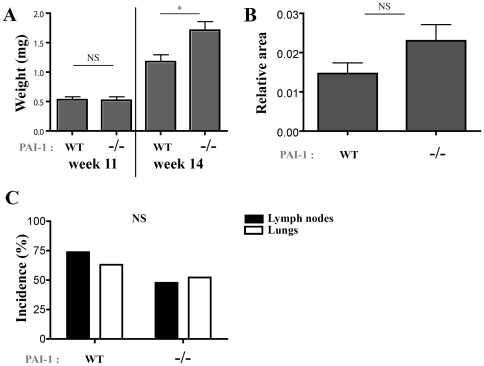
Figure 3. Primary tumor development and metastatic potential of PyMT mice crossed with PAI-1 WT or PAI-1−/− mice.
Presented results are from 11- and 14-week mice. (A): Tumor weight and (B): podoplanin positive relative surface in primary tumors observed in PAI-1 WT and PAI-1−/− mice. (C): Percentage of metastasis in lymph nodes (black columns) and lungs (white columns). n = 16 PAI-1 WT-PyMT and 17 PAI-1−/−-PyMT mice at 14 weeks, 17 PAI-1 WT-PyMT and 9 PAI-1−/−-PyMT mice at 11 weeks. Data are ± S.E.M. *P≤0.05, NS = Non Significant.

