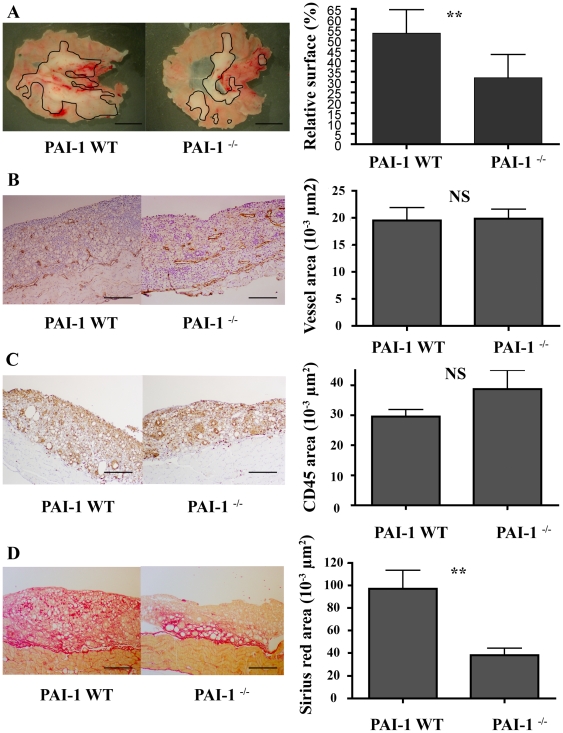
Figure 4. Development of lymphangioma in PAI-1 WT or PAI-1−/− mice.
A macroscopic decrease of lymphangioma is observed in PAI-1−/− as compared to WT (A). Similar recruitment of lymphatic vessels (assessed by Lyve-1 positivity) (B), and of CD45 positive-inflammatory cells (C) was observed in both genotypes. Evaluation of fibrosis was performed by Sirius red staining (D). Representative images are shown on the left and quantifications performed by computerized image analysis are shown on the right Data are ± S.E.M (n = 6). Scale bars: A = 0.5 mm, B–D = 200 µm, ** P≤0.01.

