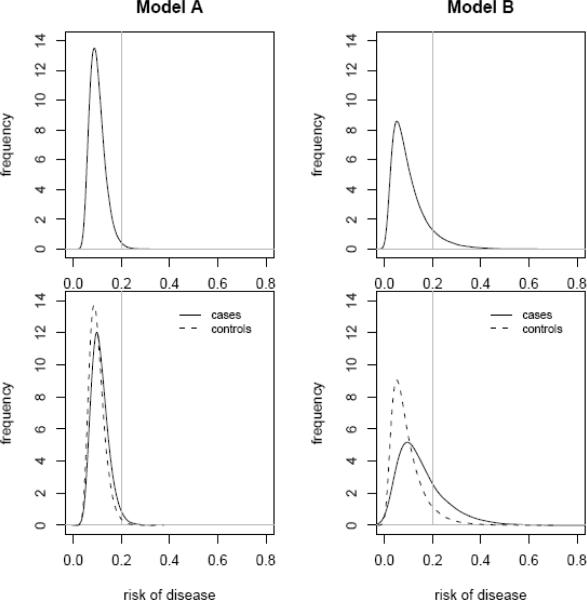
Figure 1.
Distributions of risks for two risk models involving different sets of genes, model A and model B. Distributions are displayed using probability density functions. Probability densities are shown for the population as a whole in the upper panels and separately in the lower panels for cases, those destined to have events and controls, those destined not to have events. Vertical lines are displayed at the high risk threshold, riskH, equal to 0.2. Subjects whose risks exceed 20% are regarded as being at high risk.

