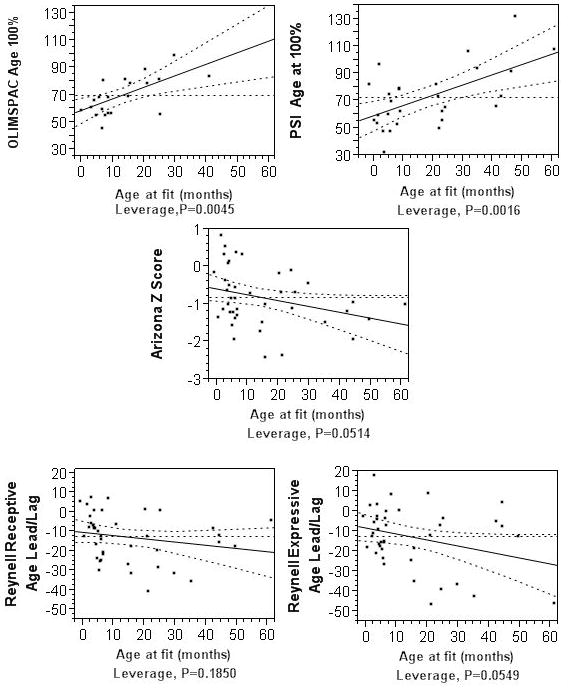
Figure 12.

Leverage plots (Sall, 1990) of modeled linear relationships between each outcome and age at fitting of amplification. The solid lines indicate the modeled relationship, the dashed lines indicate the area within a .05 significance region and the horizontal dashed line is the group mean of the outcome measure.
