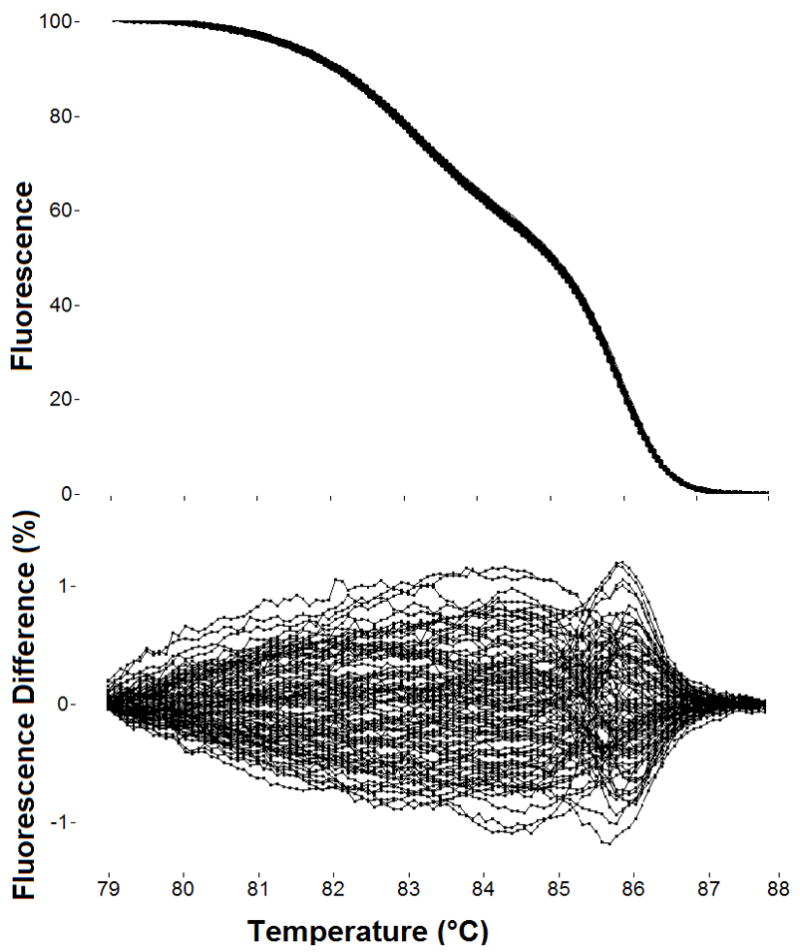
Fig. 2.

Ninety-five melting curves of CYBB exon 1 after PCR from the DNA of 95 healthy individuals. After exponential background subtraction, melting curves are shown normalized and overlaid (top) and as a difference from the average (bottom). No sequence variations were detected in the 146 bp product with two domains, typical of the low variation found in CYBB. Melting curves were acquired on the LightScanner in the presence of the saturating DNA dye, LCGreen Plus. The overall reproducibility of PCR and melting analysis can be assessed from the tightness of such clusters, typically +/− 1% on difference plots.
