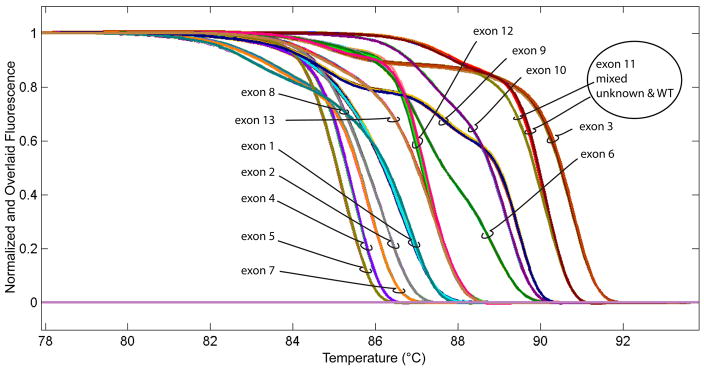
Fig. 4.
Normalized and overlaid high resolution melting curves for all 13 CYBB exons. All traces were generated on a single 96-well plate using 3 samples run in duplicate. The samples analyzed were an unknown male, a wild type male (WT) and a mixed sample containing both unknown and WT. The traces for exon 11 (circled) suggested a heterozygous sequence in the mixed sample. The traces for the other 12 exons were normal. Additional analysis of exon 11 for this unknown male sample is shown in Fig. 5.

