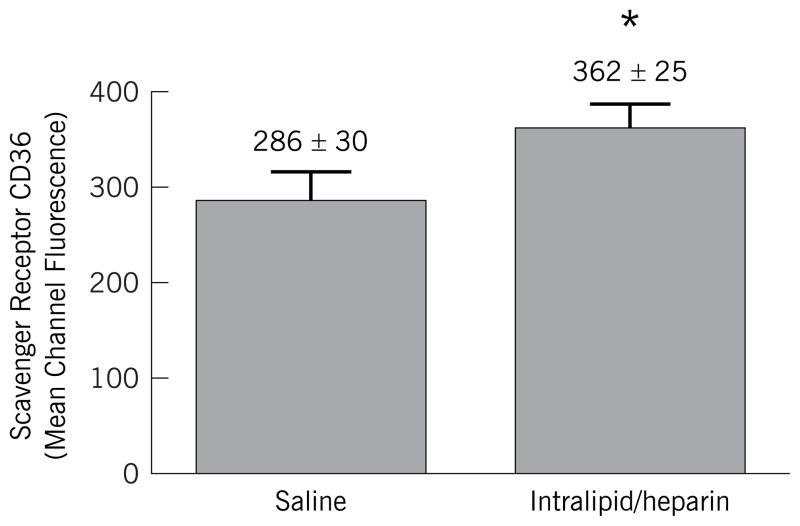
Figure 2. Mean Channel Fluorescence for CD36 Expression in CD14 Positive Cells from Peripheral Blood Mononuclear Cells during Saline and Lipid Infusion.
Mean fluorescence intensity of FITC-conjugated anti-CD36 binding to CD14+ cells. Cells were co-incubated with FITC-conjugated andti-CD36 and PE-conjugated anti-CD14 or isotype matched controls and analyzed by flow cytometry as in Figure 1. * = P < 0.05

