
Fig. 16.
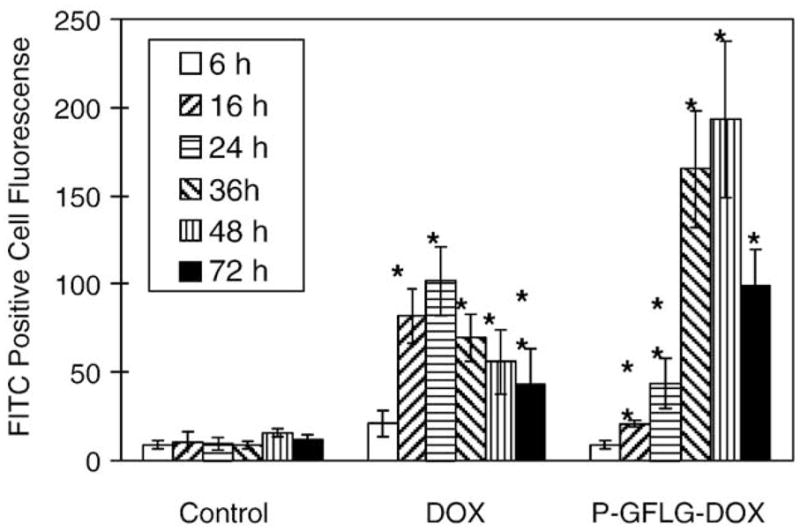
FAS receptor expression on human ovarian A2780 cells after exposure to 2×IC50 concentration of DOX and P(GFLG)–DOX for 24 h. After incubation with drugs, cells sequentially were washed, incubated with monoclonal anti-Fas, washed, and stained with FITC-conjugated goat anti-mouse IgG antibody. Cell fluorescence was analyzed on a FAC Scan flow cytometer. Data are presented as the mean±S.D. Statistical comparisons were made between cells treated with drug and untreated cells at representative time points (*p<0.01; **p<0.05) [92].