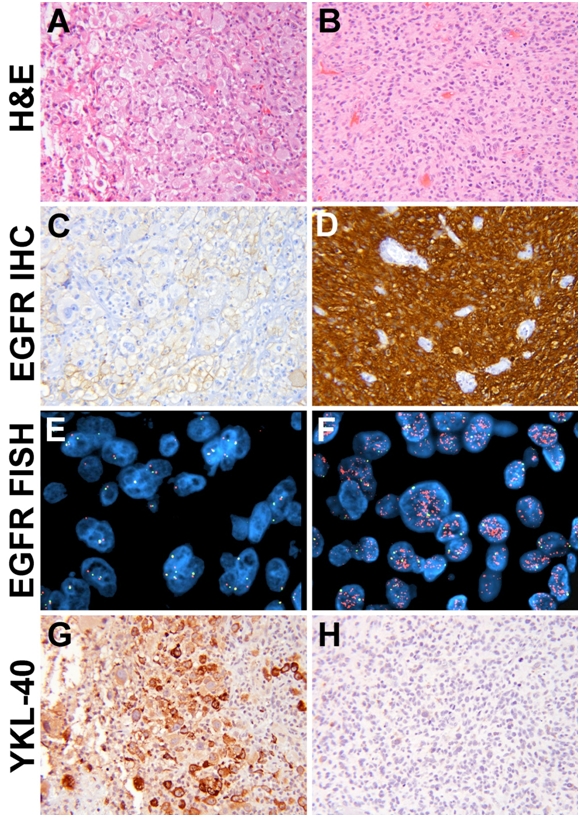
Figure 3.

YKL-40 expression is reduced in GBMs with EGFR amplification. Tumors with weak EGFR expression (A, C) also tended to lack EGFR amplification (E) but produced YKL-40 (G). In contrast, tumors strong for EGFR (B, D) were likely to show EGFR amplification (F) but not YKL-40 (H). (P = 0.003 via FISH and = 0.001 via EGFR IHC). Orange signal = 7q34, green = CEP7. All H & E and immunohistochemical images are 200× magnification; both FISH images are 1000× magnification.
