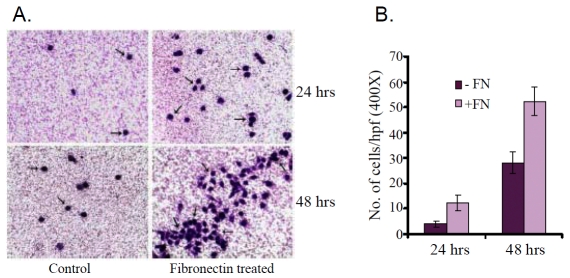
Figure 11.
(A) Fibronectin treated and untreated (Control) K562 cells were seeded into transwell insert and were allowed to grow for 24 and 48 hrs. Figure shows K562 cell migration through membrane. (B) Number of control (-FN) and fibronectin treated (+FN) K562 cell migrated through transwell insert were counted per high power field after 24 and 48 hrs of cell seeded.

