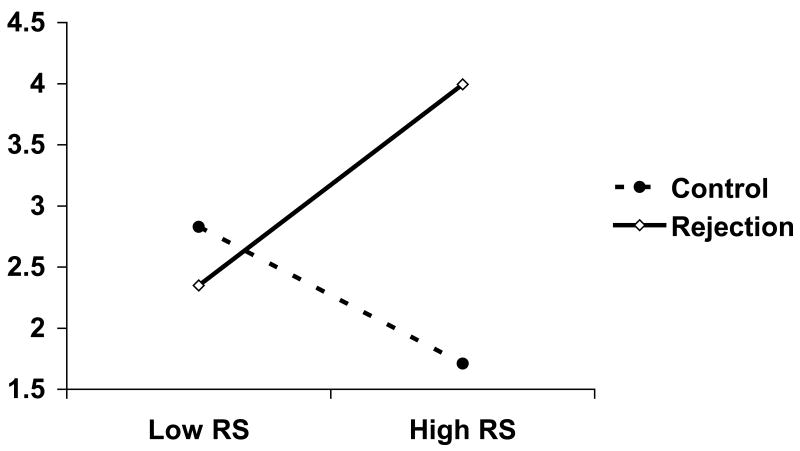
Figure 1.
Amount of hot sauce allocated as a function of experimental condition and Rejection Sensitivity (RS) controlling for perceived spiciness and angry mood.
Notes. The hot sauce distribution has been square root transformed. The predicted values were based on the following estimates from the GLM analysis:
Hot sauce = 2.27 - .63(spiciness)*** - .32(baseline anger) + .90(manipulation)* -.17(RS) + .42(RS × manipulation)**
*p < .05. **p < .01. ***p < .001

