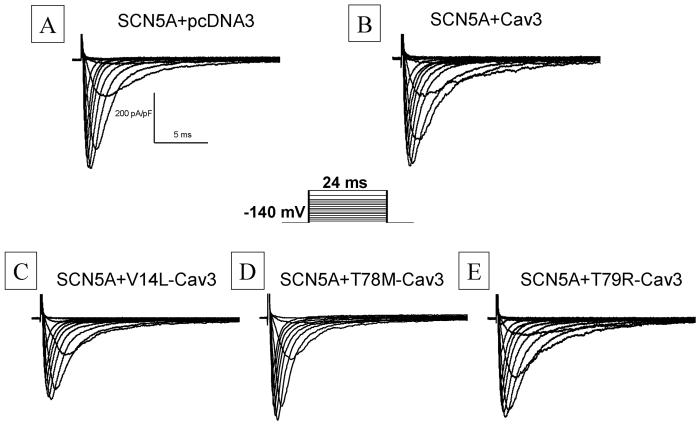
Figure 2.
Whole Cell Sodium Current (INa) Traces. Whole cell INa traces were recorded with test potentials of 24 ms duration from -120 to +60 mV from a holding potential of -140 mV. Representative INa traces were recorded from pcDNA3(panel A), WT Cav3 (panel B), V14L (panel C), T78M (Panel D) and T79R (panel E) transiently expressed in NaV1.5 stable cell lines

