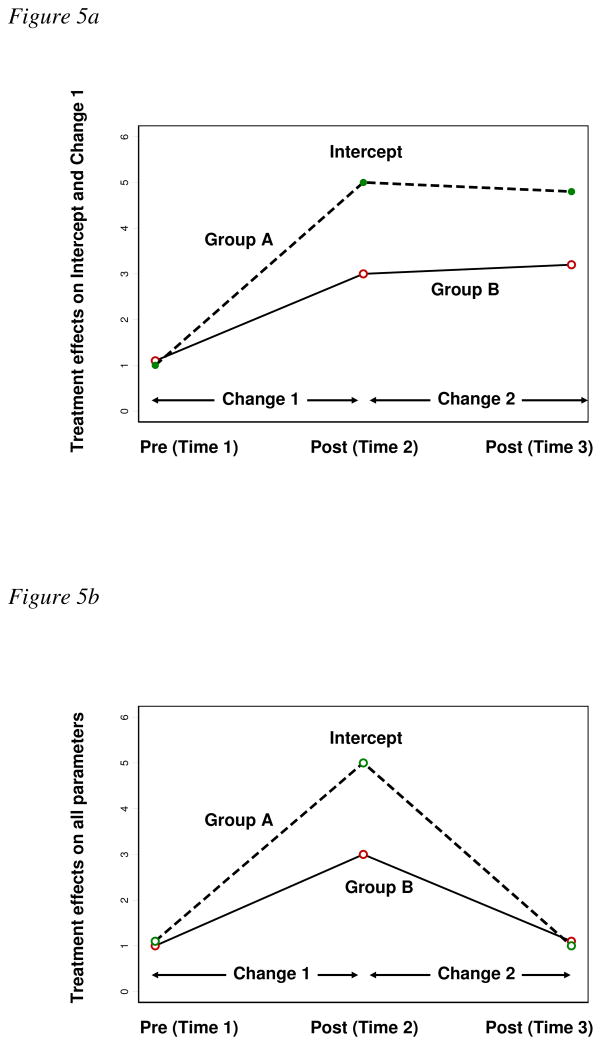
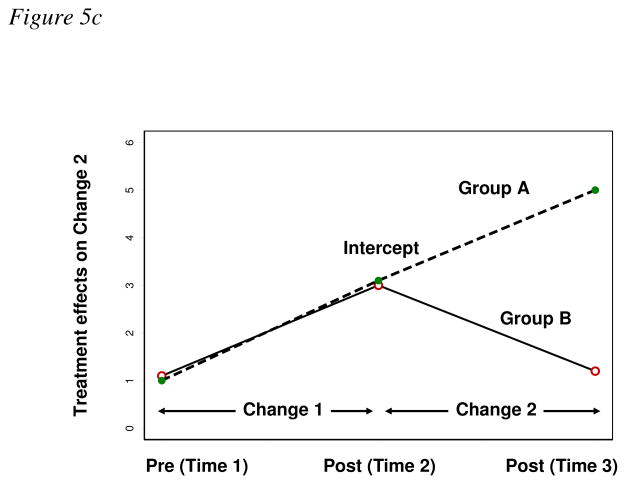
Figure 5.
Graphically illustrated possible treatment effects using the conditional LCMs in Figure 3c. The intercept is specified to match the level at Time 2 and the changes are measured against the level at Time 2. Figure 5a illustrates treatment effects on the intercept level and on the initial change from baseline (Time 1) to the first follow-up (Time 2). Figure 5b illustrates treatment effects on the intercept, the initial change, and the subsequent change. Figure 5c illustrates treatment effects on the change between Time 2 and Time 3.


