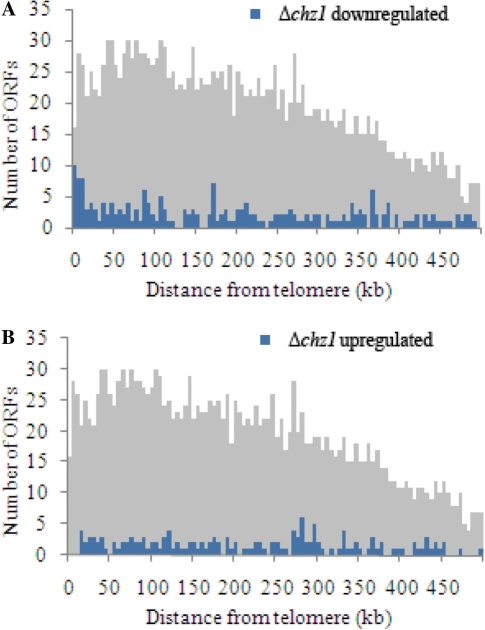
Figure 1.
Genes exhibiting aberrant expression in cell lacking CHZ1 map to distinct chromosome regions. Chromosome position analysis was done on genes with significant differential expression in Δchz1 that were repressed (A) or induced (B) more than 2-fold. For each gene, the distance to the nearest telomere was determined and these distances were grouped into 5-kb bins and plotted as a function of telomeric distance. The shaded histograms indicate the distribution of telomeric distances for all ORFs plotted at one-third scale on the y-axis.

