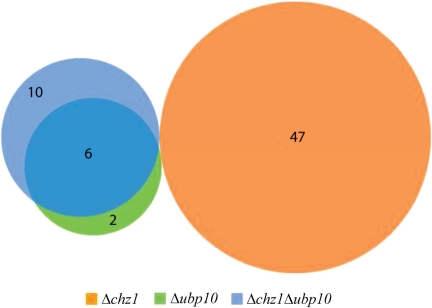
Figure 7.
Comparison of genes with altered transcriptional profiles in Δchz1, Δubp10 and Δchz1, Δubp10 mutants. Venn diagram depicting the numbers of genes affected in their transcriptional levels (downregulated ≥ 2-fold) within 50 kb from telomeres as detected by microarray in Δchz1, Δubp10 and Δchz1, Δubp10 mutant strains.

