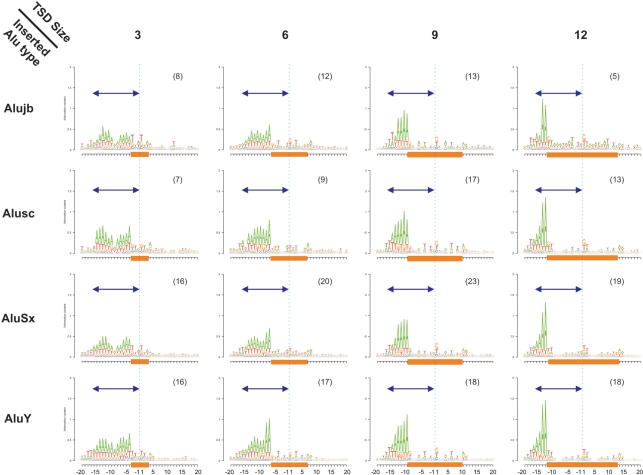
Figure 5.
Alu insertion profile reveals negative correlation between the size of an A-rich stretch and downstream TSD size. The insertion profiles of different Alu sequences from different ages (AluJ–AluY) are presented with four variable sizes of TSD. The dark blue arrow indicates a length of 16 bp, which is the nearly constant distance between the two nicking positions of L1 endonuclease, one in sense and the other in antisense. To the left side of the arrow is TT|AAAA, complementary to the TTTT|AA canonical L1 endonuclease nicking site in the antisense strand. Cyan dashed vertical lines denote the TE insertion position. Orange rectangles denote the TSD region. The number in parenthesis in the title of each pictogram denotes the number of different insertion types (insertions into different target sequences) on which the insertion profile is based.

