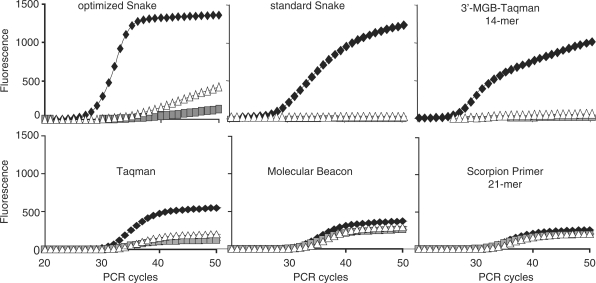
Figure 11.
Detection of SNP variations in the β2-macroglobulin target sequence by Snake and other FRET probe detection technologies. The primers and probes used in each individual assay are shown in Figure 10. A second set of a FRET probe and a corresponding 5′-flap forward primer was used in the Snake assays shown here. All assays except optimized Snake were performed using equal concentrations of primers and probe (200 nM, symmetric PCR) according to the standard reaction composition and PCR time/temperature profile described in ‘Materials and Methods’ section. The optimized Snake assay was performed using the reaction compositions and PCR protocol (45 s annealing) described in Figure 8. The real-time curves for the match target are shown by black rectangles whereas white triangles and gray squares are used to show the mismatch target signals. The fluorescence scale is identical for all diagrams. The results of this technology assessment study are summarized in Table 1.

