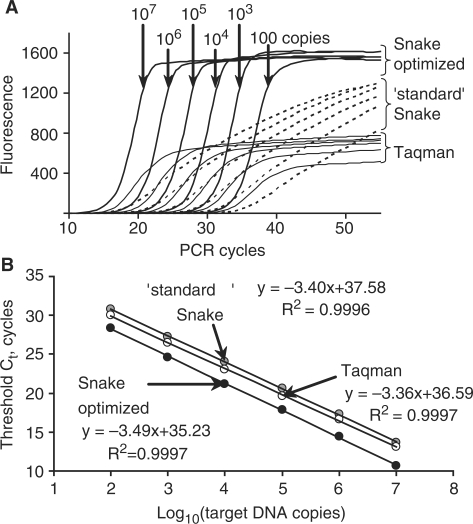
Figure 9.
Use of the Snake assay for quantitative measurements of target nucleic acids. (A) The real-time fluorescence curves for the detection of variable amounts of the β2-macroglobulin target sequence by the Snake assay performed in optimized and standard reaction conditions and conventional Taqman. As indicated, the amounts of the target sequence in the reactions ranged from 100 to 107 copies with an order of magnitude increment. The reaction compositions and PCR protocols used for each of the methods are described in Figure 8. The optimized Snake assay was carried out using 75 s of annealing time. The threshold values were determined for each of the curves and plotted versus the logarithm of the target DNA amounts used in the detection experiments. The results are shown in (B). Also shown are the linear trendline equations and coefficients of determination (R2) calculated for each of the assays.

