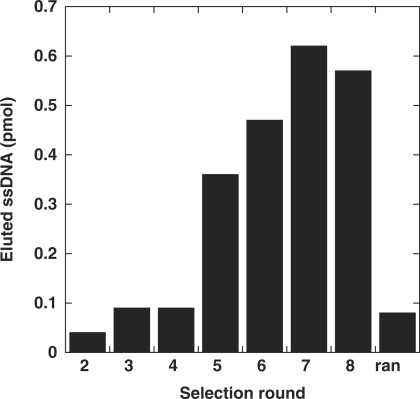
Figure 2.
Enrichment of aptamers during the selection. All probes were labelled with 6-FAM at their 5′ terminus to allow quantification of the recovered oligonucleotide. The bar graph shows the amount of oligonucleotide eluted from the target in each selection round. The quantity is expressed in pmol. Serial dilutions of a 6-FAM oligonucleotide were used to calibrate the quantification assay. Oligonucleotides from round 1 were not labelled and therefore could not be quantified. We prepared a small amount of labelled random oligonucleotides in order to quantitate their affinity for the target (marked here as « ran »).

