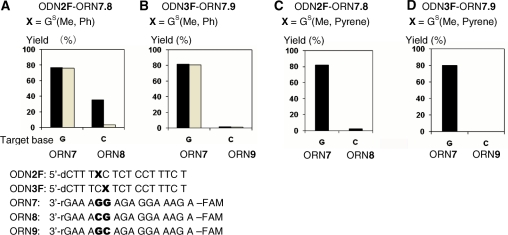
Figure 6.
Site-selectivity of the functionality transfer reaction. The transfer reactions were performed using 1.5 µM of S-functionalized ODN2F, 3F and 1.0 µM of the target ORN7, 8 or 9 in 50 mM carbonate buffer containing 100 mM NaCl at pH 9.6 for 1 h, followed by HPLC monitored by fluorescence at 518 nm with emission at 494 nm. (A) ODN2F-ORN7.8, X = GS(Me,Ph). Grey bars indicate the reaction yield after treatment of aqueous NH3. (B) ODN3F-ORN7.9, X = GS(Me,Ph). Grey bars indicate the reaction yield after treatment of aqueous NH3. (C) ODN2F-ORN7.8, X = GS(Me, Pyrene). (D) ODN3F-ORN7.9, GS(Me, Pyrene).

