
Figure 6. The expression of BMP receptors and BMP2 ligand increase during osteoclast differentiation.
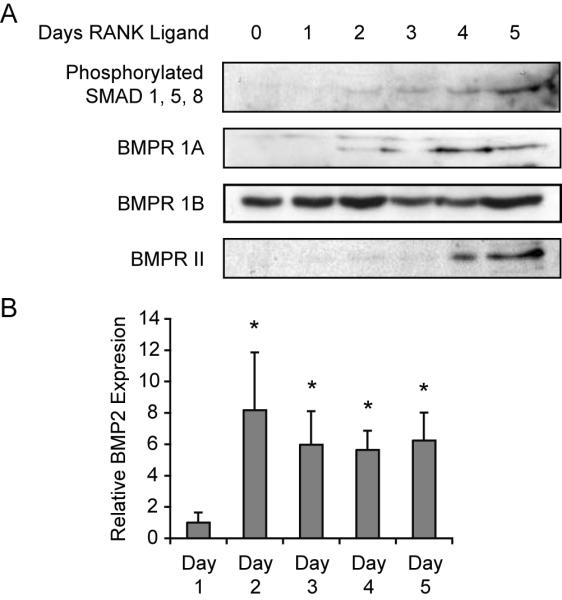
A. Immunoblot analysis of osteoclast precursors showing protein expression of BMP receptors and levels of phosphorylated SMAD 1, 5, 8 on the indicated days of differentiation. B. Real-time PCR quantitation of BMP2 expression in osteoclast precursors on each day of differentiation. Gene expression was determined in triplicate, normalized with GAPDH and is graphed relative to expression on Day 1. * p≤0.001 vs Day 1.