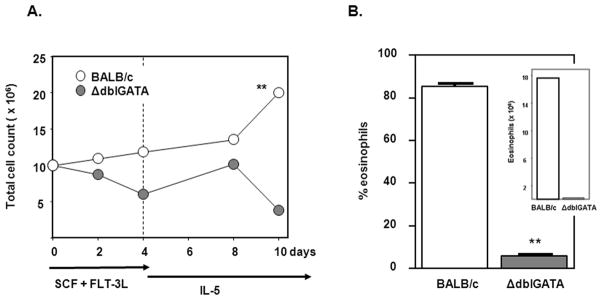
Figure 4. Eosinophils generated from bone marrow of ΔdblGATA eosinophil-deficient mice.
(A) Bone marrow cultures were initiated at 107 cells/mL. The number of viable cells was determined at timepoints shown in response to the cytokine regimen described in the Legend to Figure 1. Significant difference between counts detected at day 10, **p < 0.01. (B) Eosinophils identified by side scatter and Siglec F expression are shown as percent total cell number on day 10, **p < 0.01. Inset: number of eosinophils in bone marrow culture at day 10 as calculated from the data in (A) and (B).

