Fig. 5.
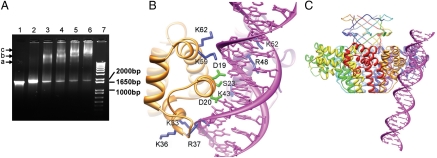
DNA-binding of gp1. (A) Electrophoretic mobility shift assay of DNA-binding of gp1. Lane 7, 1 kb Plus DNA ladder (Invitrogen). The positions of three DNA species of 1,000, 1,650, and 2,000 bp are indicated. Lane 1, the DNA encompassing the gp1- and gp2-coding regions (1,836 bp) alone. Lane 2–6, the same amount of DNA as in Lane 1 but incubated with 25 μM, 50 μM, 75 μM, 100 μM, and 125 μM gp1, respectively prior to being loaded onto the gel. The bands corresponding to three species of nucleoprotein complexes are indicated with arrows and labeled with a, b, and c, respectively. (B) Modeled molecular interactions of two adjacent gp1 DNA-binding domains (Gold and Purple Ribbon Diagrams) with DNA (Magenta). Side chains of residues putatively involved in contact with DNA backbones and the major groove are shown in blue and green, respectively. Notice that three residues, K43, R48, and K52, belong to the gp1 monomer behind the DNA. (C) A panoramic view of the gp1 octameric assembly with the putative bound DNA. The view is nearly the same as in (B).

